

I Taught My iPhone to Stalk My Profiles and Take Notes
The system I use to automate my analytics and create a cross-platform dashboard


I used to check my follower counts like I was checking to see if my crush texted back. Obsessively. Desperately. With absolutely zero chill. Instagram at breakfast. LinkedIn while pretending to work. YouTube at lunch. Substack before bed. Then back to Instagram because maybe something changed in four hours.
Meanwhile, my iPhone just sat there like a silent accomplice, watching me compulsively refresh the same four apps and politely pretending that any of this qualified as progress.
You know this routine. By evening, you’ve checked each platform 4 times and successfully replaced one anxiety (not knowing your numbers) with another (knowing your numbers but having no context for whether they matter).
And the doom-scroll collateral damage? You went to check one number and somehow ended up watching a 9-minute video about a guy building a house out of mud.
Platforms want you compulsive, not informed. Their business model depends on you opening the app, getting distracted, scrolling, engaging, staying. Analytics are buried behind just enough friction that you have to wade through your feed to access them.
You’re surrounded by data but starved for clarity. The only way to see your numbers is to subject yourself to the attention economy’s slot machine. Obsession becomes the access method.
This is a structural problem. The tools are designed to keep you there.
That’s when it hit me: Why not train my phone to hop around my apps, gather what I need, and take notes for me to review?
Now it checks my profiles for me, logs the data, builds graphs, and lets me see actual trends. Just Shortcuts, Numbers, and a firm decision not to let apps run my morning. And this same setup works for any number you keep checking but never remember: expenses, habits, business metrics, even personal goals.
Here’s how to train your iPhone to scroll your apps, gather data and keep track of everything, so you don’t have to.
The Drop (TL;DR)
This shortcut tracks one consistent metric in a spreadsheet in Numbers on your iPhone, replacing emotional spot-checks with actual data.
Setup takes about 10 minutes using Shortcuts, Numbers, and Apple Intelligence (on-device text extraction).
What This System Actually Looks Like
Before I explain how to build it, let me show you what using it feels like, because understanding the end state makes the technical stuff make sense.
The Dashboard View
Your data lives in one app: Numbers.

You can access your file across devices by saving to the iCloud, so you update on your phone and open on your laptop if you want to dive deeper.

Open it, and you see:
A line graph for each platform showing follower growth over time
Your total follower count across all platforms
Time-based trends (week-over-week, month-over-month)
Filterable, timestamped data going back as far as you’ve been tracking
Just clean, structured data that answers the question: “Am I growing, and where?”
The Daily Interaction: One Tap, Ten Seconds
Once a day I tap a shortcut icon on my home screen and my phone: opens TikTok, waits for the profile to load, takes a screenshot and extracts the follower count using Apple Intelligence. Then it continues to the next platform.
After it’s collected the data, it opens my Numbers spreadsheet and logs a new row: today’s date, each platform’s current count, and a calculated total.

I don’t scroll. I don’t get distracted. I don’t see notifications. The shortcut runs, the data logs, and I’m done. Just data accumulating quietly, compounding into something useful.
How it Works
This system has three parts:
The Shortcut acts as your data collector. It’s the robot that visits each platform, grabs the number you care about, and hands it off to the next component.
The Spreadsheet is your data store. It’s where every number gets logged with a timestamp. This is the part you own. No cloud service can shut this down. No terms of service can change. It’s a file on your device.
The Dashboard is your visual layer within the spreadsheet. It’s how you turn rows of numbers into something your brain can process in under five seconds.
Every piece uses built-in Apple tools so there are no APIs to authenticate, third-party services to trust, or integrations that’ll break when someone deprecates a feature.
And the pattern is repeatable. Once you build it for one platform, adding another is as simple as duplicating your actions in the shortcut and changing the URL or app to open.
The Shortcut: Your Personal Data Collection Robot
The core of this system is a Shortcut that follows the same pattern for every platform you want to track.
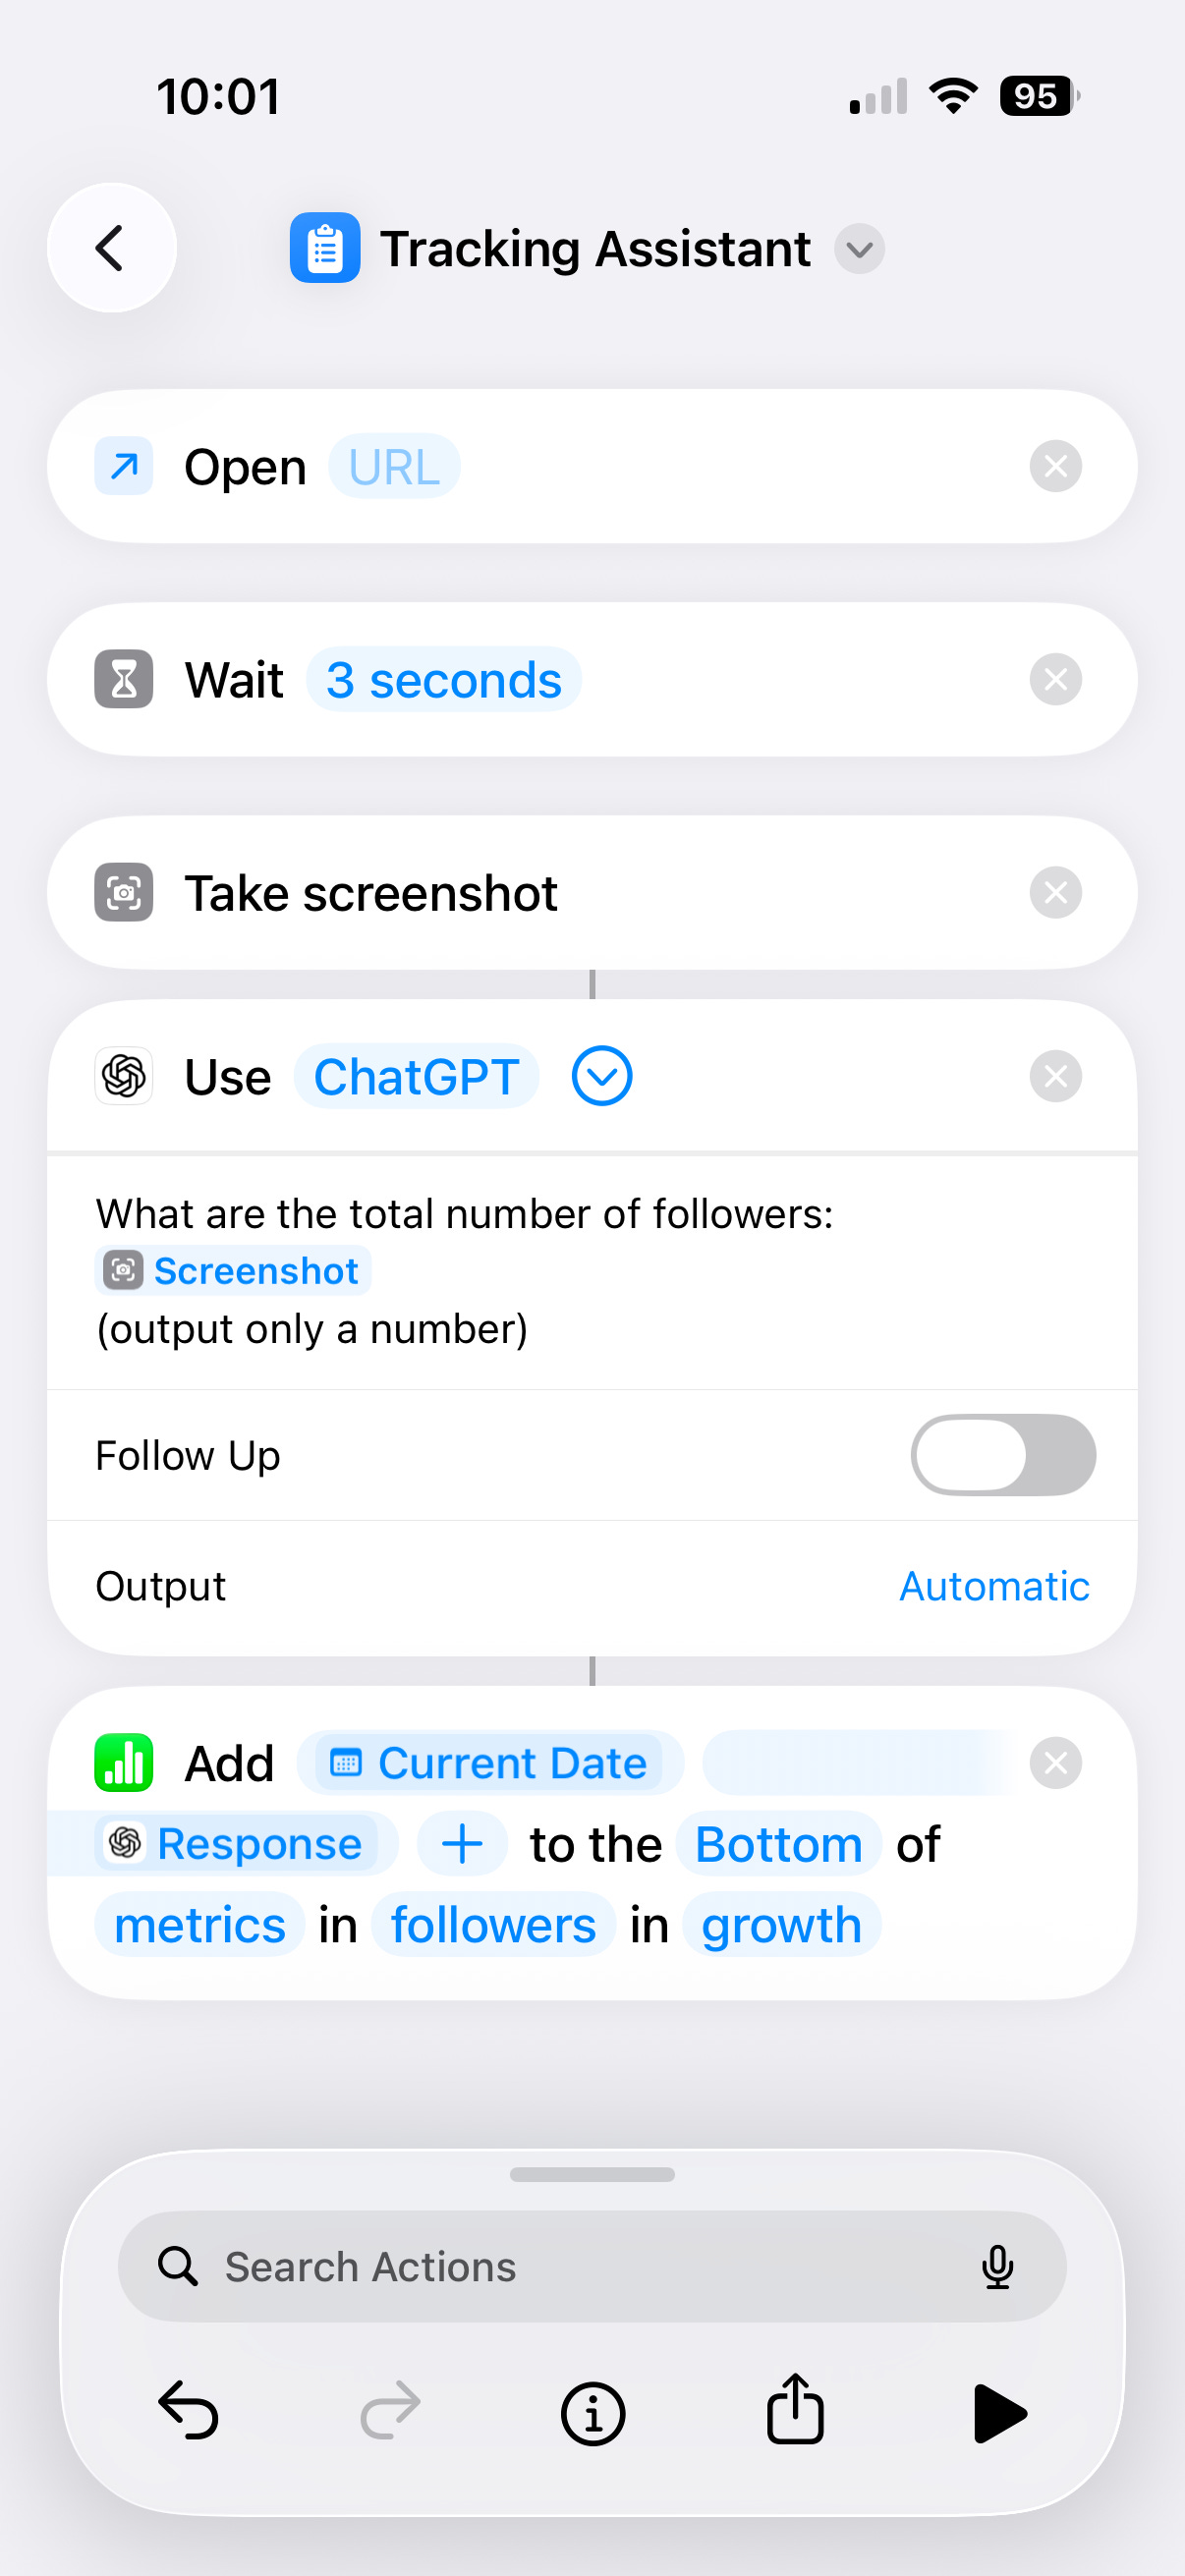
Open the app (or URL) → Wait for it to load → Screenshot the relevant data → Extract the number you need → Store it as a variable
Shortcuts beat using your memory, because you’re not asking your brain to hold five numbers while you navigate to a spreadsheet. The Shortcut does that job and you just supervise.
Selecting Your Model: On-Device AI vs “Ask ChatGPT”
This Shortcut can run entirely on-device using Apple Intelligence, which means screenshots are processed locally and never leave your phone. That’s the setup to use when you want speed, privacy, and fewer points of failure.
, On-Device, Extension (ChatGPT), and Ask Each Time, with the ChatGPT extension currently selected.")
You can also use “Ask ChatGPT” for extraction if you want more flexible parsing or already rely on cloud models.
Same system, same outcome: You decide whether the work happens on your phone or in the cloud.
The Spreadsheet: Where Your Data Lives
Your Numbers spreadsheet is where the magic turns into something permanent.
Here are the columns I have in my setup:
Date: This logs when the data was captured. Use the Shortcuts “Current Date” variable to auto-populate this.
Platform columns: Add a column for each service you’re tracking. Instagram, TikTok, Substack, whatever. Each column gets the variable from the Shortcut.
Total column: A simple SUM formula that adds up all your platform columns. This gives you your total audience size across everything.
That’s it: just columns and a simple total formula.
What This System Doesn’t Do
This is a tracking system, which means it will show you what’s happening, but it won’t tell you why, or what to do about it.
If your follower count drops, the dashboard will show you the trend. It won’t tell you whether it’s because of an algorithm change, a bad post, or seasonal audience behavior.
This system also doesn’t track engagement, reach, impressions, or any of the deeper metrics that platforms bury behind their analytics dashboards. You could theoretically extend the Shortcut to capture those, but the goal for me was to capture one metric across platforms. This is deliberately focused on follower counts because they’re consistent, visible, and easy to extract.
Building This System on Your Phone
Ready to install? I’ve packaged the full Platform Tracking Assistant Shortcut and Numbers template along with the advanced installation guide below for subscribers.
